When a developer broke ground on a five-story mixed-use building near the Avenir Centre, they encountered something the preliminary boreholes missed: a buried paleochannel filled with soft organic silts cutting diagonally across the site. The crew hit water at three meters and the excavation walls started slumping. That is exactly the kind of scenario where seismic tomography changes the decision timeline. Rather than drilling blindly at ten-meter spacing and hoping to intercept the feature, a refraction and reflection survey laid out a continuous velocity cross-section that traced the channel boundaries within a single day of fieldwork. In Moncton, where the Petitcodiac River has reworked the floodplain sediments for millennia and the underlying Carboniferous bedrock—sandstone and shale of the Mabou Group—can drop abruptly beneath compressible alluvium, the ability to image the subsurface between boreholes is not a luxury; it is the difference between a foundation design that holds and one that requires costly mid-construction redesign. We often pair these tomographic profiles with a targeted SPT drilling campaign to calibrate seismic velocities against measured N-values, giving the geotechnical engineer a calibrated ground model that satisfies Part 4 of the NBCC.
A single seismic line can replace a dozen speculative boreholes when the question is where bedrock drops beneath compressible clays.
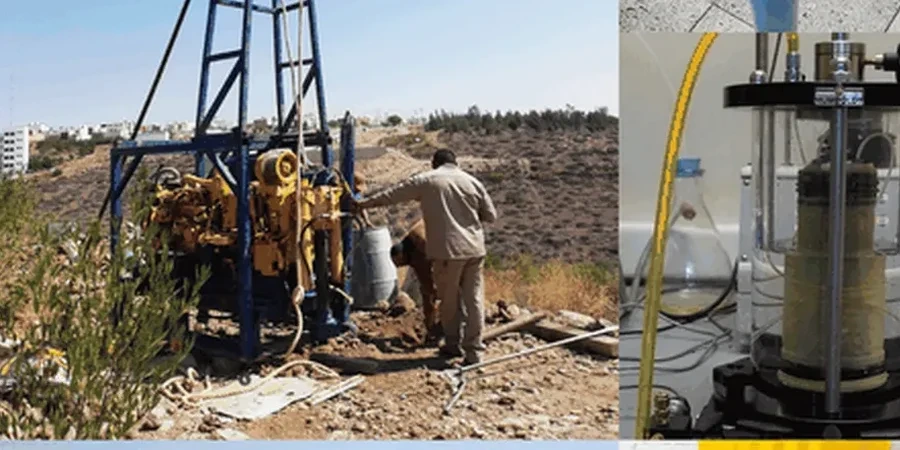
Technical details of the service in Moncton
Critical ground factors in Moncton
The contrast between Moncton’s riverfront district and the higher ground west of Vaughan Harvey Boulevard illustrates the risk we see repeatedly. The riverfront sits on recent alluvial deposits—soft gray clays with interbedded silt lenses—that shear at low strain and amplify ground motion differently than the dense glacial till found just a kilometer uphill. If a design team treats the entire site as uniform based on one or two boreholes, they risk differential settlement severe enough to crack partition walls and bind elevator rails. Seismic tomography exposes these lateral transitions before the foundation concrete is poured. When the velocity section shows a low-velocity wedge pinching out against a stiffer unit, we know exactly where to place additional investigation points and where the structural engineer needs to stiffen the foundation system. The NBCC site classification—which governs the seismic design forces—depends on the average shear-wave velocity in the upper thirty meters, and a tomographic survey provides that parameter continuously rather than at isolated borehole locations, reducing the chance of misclassifying a site and either overbuilding or underdesigning the lateral force-resisting system.
Our services
Each seismic tomography survey is configured around the specific geological question the project raises—whether that means mapping bedrock topography, detecting fracture zones, or estimating rippability for excavation planning.
Seismic Refraction Tomography
A linear array of 24 or 48 geophones records first-arrival travel times from hammer or weight-drop sources at multiple shot points, with the data inverted via iterative ray-tracing to produce a continuous P-wave velocity cross-section showing stratigraphic layering, bedrock depth, and low-velocity anomalies indicative of soft or disturbed ground.
Multi-Channel Seismic Reflection
Higher-resolution profiling for deeper targets, using a rolling spread of geophones and a high-energy source to image reflectors such as the bedrock surface, intra-sedimentary unconformities, or fault planes. Processing includes normal moveout correction, stacking, and depth migration.
MASW and Vs Profiling
Active-source surface wave acquisition processed to extract a one-dimensional shear-wave velocity profile (Vs vs. depth) for NBCC site class determination. Often run in parallel with refraction lines to provide both P-wave and S-wave velocity models for the same transect.
Rippability and Excavation Assessment
Seismic velocity thresholds calibrated against local Carboniferous sedimentary and granitic rock types to classify the excavation method required—whether mechanical ripping, hydraulic hammering, or blasting—saving contractors from bidding errors on Moncton infrastructure projects.
Common questions
How deep can seismic tomography image in the Moncton area?
Refraction surveys using a 115-meter spread and a weight-drop source typically resolve features down to 30 to 35 meters, which captures the entire overburden sequence and the top of bedrock across most of the Petitcodiac basin. Multi-channel reflection profiling extends that range to 100 meters or more, useful when the target is a deep bedrock depression or a suspected fault zone within the Mabou Group sedimentary rocks.
What does a seismic tomography survey cost for a typical Moncton lot?
For a standard refraction line covering a residential or light commercial site—roughly 100 to 150 linear meters with a 24-channel array—the cost ranges from CA$3,930 to CA$6,250, which includes mobilization, acquisition, tomographic inversion, and a signed engineering report. Longer profiles, multi-line grids, or combined refraction and reflection push toward the upper end of that range.
Can seismic tomography replace boreholes entirely?
No, and we would never recommend that. Seismic tomography provides continuous spatial coverage at a fraction of the cost of a dense borehole grid, but it measures velocity, not direct material properties. You still need boreholes—at a minimum, one per velocity zone—to calibrate the tomogram and to recover samples for laboratory classification, strength testing, and consolidation analysis.
How does the NBCC use seismic tomography results?
The National Building Code of Canada classifies sites based on the time-averaged shear-wave velocity in the upper 30 meters (Vs30). A tomographic survey—particularly when combined with MASW or downhole seismic testing—provides a measured Vs30 value rather than a conservative default, which can shift the site class from D to C and reduce the design seismic forces, often saving money on the structural frame without compromising safety.